

You ran the numbers last quarter and got blindsided anyway. Demand spiked where you had no stock, and sat flat where you’d bet the budget. The post-mortem said “we need better forecasting.” Then someone priced a predictive analytics platform, you saw the per-seat number, and the project quietly died.
Open source predictive analytics is the way out of that loop — but not for the reason most listicles claim. The win isn’t that the software is free. The win is that you can see inside the model, run it on your own hardware, and keep the forecast when the vendor changes their pricing page. The cost just moves somewhere else, and this guide is honest about where.
Here’s what you’re getting: a comparison table built from live repository data pulled the day this was updated, a dedicated breakdown of the forecasting stack most guides get wrong, the JVM options nobody bothers to list, and a decision path that ends with you picking one tool instead of bookmarking twelve.
What Open Source Predictive Analytics Actually Buys You (And What It Doesn’t)

Let’s kill the confusion between “free” and “open source” first, because it costs people real money.
自由的 means you don’t pay for the license. Plenty of commercial platforms have a free tier — it’s a funnel, and it ends at a row limit or a seat count. 開源 means you get the source code under a license that lets you run, read, modify, and redistribute it. Those are different promises. A free tier can be revoked on a Tuesday. An Apache-2.0 license can’t.
What open source actually buys you:
- No seat tax. Twenty analysts cost the same as one. For a small team, this is usually the single biggest line item that disappears.
- Model transparency. You can read why the forecast said what it said. When a prediction drives a purchasing decision, “the vendor’s black box told us” is not a defensible answer.
- Data residency on your terms. Your customer data never leaves infrastructure you control. For anyone in a regulated category, this alone decides the question.
- No deprecation risk. If the maintainers walk away, the last working version still works. You can fork it. Try that with a SaaS sunset email.
And what it doesn’t buy you — the part the listicles skip:
- You are now the support team. There’s no SLA. When the model breaks at 2am before a board meeting, the escalation path is a GitHub issue and hope.
- Integration is your problem. Commercial platforms ship connectors. Open source ships a Python API and the assumption you’ll write the glue.
- Compute isn’t free. Training a deep forecasting model on five years of hourly data costs real money whether the library was free or not.
- The real bill is attention. Someone has to own this. If nobody does, you’ve built a forecast nobody trusts, which is worse than no forecast.
That last point is the one I’d tattoo on the project kickoff doc. I run a fleet of autonomous containers, and the pattern holds everywhere: the license fee was never the expensive part. The expensive part is the maintenance tax, and it shows up on month three. I broke the same math down for workflow tooling in the real cost of running n8n self-hosted — the shape of the bill is identical here. Free to install, not free to own.
So the honest version of the pitch: open source predictive analytics is the right call when you have someone who can own it, data you’d rather not ship to a third party, or a model whose logic you need to defend. If you have none of those three, pay for the platform and spend your attention elsewhere. That’s not a cop-out — that’s the same ROI math I’d run with a consulting client.
The Open Source Predictive Analytics Tools Worth Your Time in 2026
Most comparison tables on this topic were written once and never touched again, so they quote star counts from three years ago and recommend projects that have gone quiet. Every number below was pulled from the GitHub API on 5 October 2026. Check them yourself — that’s the point of showing them.
| 工具 | Language | What it’s actually best at | 執照 | Stars |
|---|---|---|---|---|
| scikit-learn | Python | The default baseline for classification, regression, clustering | BSD-3-Clause | 67.5k |
| sktime | Python | One consistent API across forecasting and time-series classification | BSD-3-Clause | 10.1k |
| Darts | Python | Swapping classical and deep forecasters behind one interface | Apache-2.0 | 9.5k |
| StatsForecast | Python | Classical statistical forecasting, very fast, at scale | Apache-2.0 | 4.9k |
| NeuralForecast | Python | Deep-learning forecasters with a sane, uniform API | Apache-2.0 | 4.3k |
| 先知 | Python / R | Fast, decent seasonal business forecasts with minimal tuning | 麻省理工學院 | 20.4k |
| GluonTS | Python | Probabilistic forecasting — ranges, not single numbers | Apache-2.0 | 5.2k |
| PyTorch Forecasting | Python | Deep forecasting for teams already on PyTorch Lightning | 麻省理工學院 | 5.0k |
| Chronos | Python | Pretrained time-series foundation models — zero-shot forecasts | Apache-2.0 | 6.0k |
| H2O-3 | Java core, Python/R APIs | AutoML and distributed training on a cluster | Apache-2.0 | 7.5k |
| Orange | Python | Visual, no-code workflows — genuinely good for teaching | GPL-3.0 | 5.7k |
| DeepLearning4J | Java | Deep learning that deploys inside an existing JVM service | Apache-2.0 | 14.3k |
| Smile | Java / Scala / Kotlin | Broad stats and ML on the JVM, no Python bridge | Other — read it first | 6.4k |
| Tribuo | Java | Production JVM ML with provenance tracking built in | Apache-2.0 | 1.4k |
| Apache Superset | Python | BI dashboards — 不是 a forecasting engine | Apache-2.0 | 75.0k |
Three things that table tells you that a prose listicle hides.
Star counts measure popularity, not fit. Superset has the most stars on the list and cannot forecast anything. It’s a visualization layer. It shows up on “predictive analytics tool” roundups constantly, and putting it in your forecasting stack is a category error. If dashboards are what you’re actually after, I covered that separately in 預測分析儀表板最佳實踐.
Check the license text, not the badge. Apache-2.0, MIT and BSD-3-Clause are permissive — build commercial products on them freely. GPL-3.0 (Orange) carries copyleft obligations that matter if you redistribute. And when GitHub can’t classify a license — Smile shows as “Other” — that’s your cue to open the file and read it before it goes anywhere near a client deliverable.
Watch the last-commit date, not the star count. Weka is the classic trap here. It’s on every “best open source predictive analytics tools” list because it’s been on every list since 2009. Its GitHub mirror has had no pushes since August 2022, and development lives on the University of Waikato’s own infrastructure. Weka is still a fine teaching tool with an approachable GUI. It is not where I’d start a 2026 production build, and no roundup that only counts stars will tell you that.
Open Source Forecasting Tools: The Time-Series Stack Most Guides Get Wrong

This is the section I actually wanted to write, because the top-ranking results for “open source forecasting” are a mess.
Go searching and you’ll get lists that mix Prometheus, InfluxDB, Grafana and Druid in with Prophet. Those first four are time-series databases and monitoring tools. They store, query and chart data that happens to have timestamps on it. Not one of them forecasts anything. Recommending InfluxDB to someone who needs next quarter’s demand number is like recommending a filing cabinet to someone who asked for an accountant.
So here’s the actual forecasting layer, sorted by the job you’re trying to do.
If you want a decent forecast this afternoon
先知 (MIT, 20.4k stars) is still the fastest path from CSV to defensible chart. It decomposes a series into trend, seasonality and holiday effects, handles missing data and outliers without complaint, and gives you uncertainty intervals out of the box. Business data with weekly and yearly cycles is exactly what it was built for.
Its reputation took a beating when benchmark papers showed well-tuned classical models beating it, and that criticism is fair on accuracy. It’s beside the point for most teams. Prophet’s edge is that a non-specialist can get a sane result without understanding stationarity, and that it fails in obvious ways rather than subtle ones. Start here, measure, then move if the error justifies it.
If you have thousands of series and need speed
StatsForecast (Apache-2.0, 4.9k stars) from Nixtla is the one most people haven’t heard of and should have. It’s classical statistical forecasting — AutoARIMA, ETS, Theta, seasonal naive — compiled for speed and built to fit thousands of series in parallel.
This matters more than it sounds. If you’re forecasting one revenue number, any tool works. If you’re forecasting demand for 4,000 SKUs across 12 warehouses, you have 48,000 series, and the question stops being “which model is most accurate” and becomes “which library finishes before I need the answer.” StatsForecast is built for that shape of problem, and a tuned AutoARIMA is a brutally strong baseline that deep learning often fails to beat.
Pair it with MLForecast for gradient-boosting approaches and NeuralForecast (Apache-2.0, 4.3k stars) for deep models — same API conventions across all three, which means swapping approaches isn’t a rewrite.
If you want one API and the freedom to change your mind
Darts (Apache-2.0, 9.5k stars) wraps everything from naive baselines through ARIMA to N-BEATS and Temporal Fusion Transformers behind a single fit() / predict() interface. sktime (BSD-3-Clause, 10.1k stars) does something similar with a scikit-learn-compatible API spanning forecasting, classification and regression on time series.
Pick one of these when you don’t yet know which model family will win. Testing nine approaches is a loop instead of nine integration projects. That alone usually pays for the extra abstraction layer.
If you need ranges, not point estimates
GluonTS (Apache-2.0, 5.2k stars) from AWS Labs is built around probabilistic forecasting: it returns distributions, not single numbers.
This is the upgrade most businesses need and don’t ask for. “Next month will be 1,200 units” is a number you can’t plan safety stock against. “There’s an 80% chance we land between 1,050 and 1,400” tells you exactly how much buffer to carry. If your forecast feeds an inventory or staffing decision, probabilistic output isn’t a nice-to-have — it’s the whole point.
If you want to skip training entirely
Chronos (Apache-2.0, 6.0k stars) from Amazon Science is the genuinely new entry since this guide was first published. It applies the pretrained-foundation-model idea to time series: the model was trained on a large corpus of series, and you hand it your history and get a forecast back with no training run at all.
Zero-shot forecasting is a real shift in the workflow. It won’t always beat a model tuned on your specific data — but it gives you a credible baseline in minutes, which makes it the fastest honest answer to “is this series even forecastable?” Run Chronos first. If its error is already acceptable, you just skipped a two-week modelling project.
The short version of this whole section: Chronos for an instant baseline, StatsForecast for scale, Prophet for speed-to-first-chart, Darts or sktime when you need to compare, GluonTS when the output feeds a real decision. That’s five tools covering every forecasting job a small team actually has, and the monitoring databases don’t appear anywhere on the list.

取得人工智慧策略手冊
I run 10+ autonomous containers in production and send what actually works — real systems, real logs, no fluff. Grab the playbook and follow the build.
Machine Learning Forecasting Tools vs Classical Statistical Models
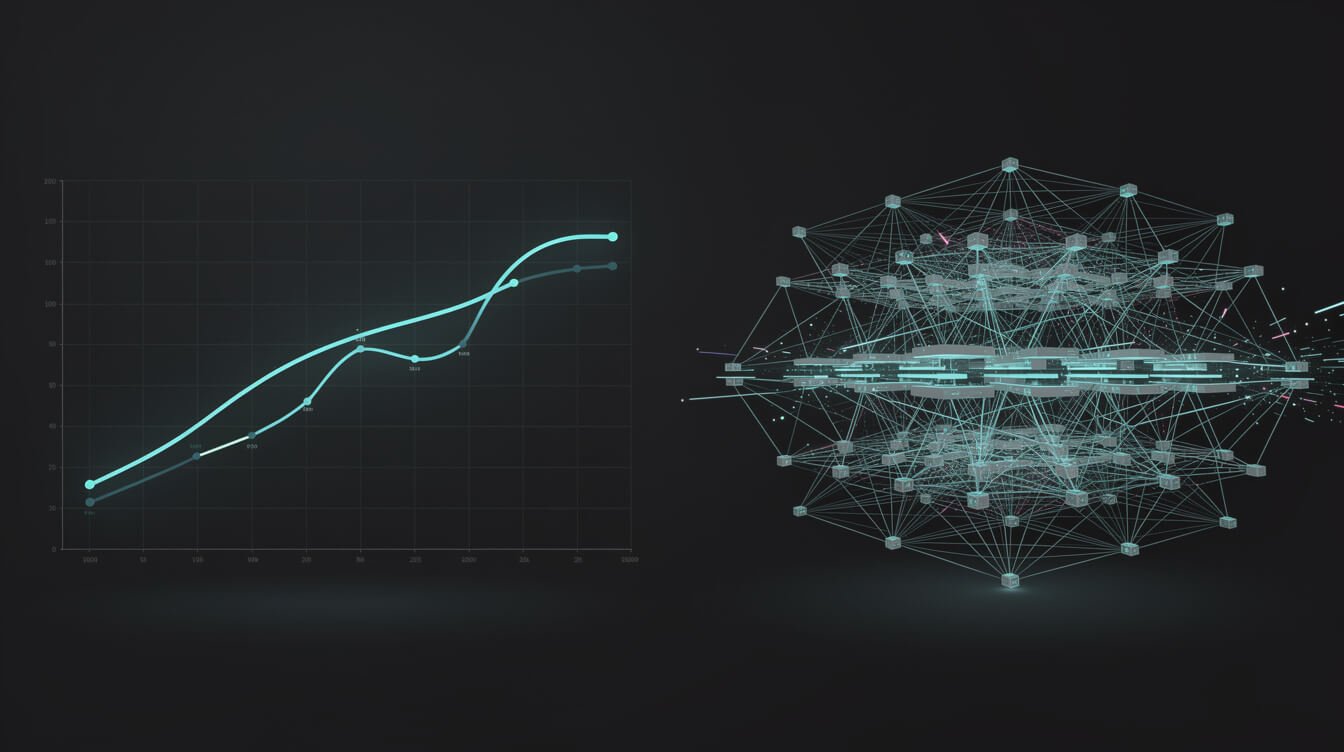
Every vendor demo in this category implies the same thing: machine learning forecasting tools beat the old statistical models. Sometimes true. Often not. And the cases where it’s not true are extremely predictable, so you can decide before you spend the two weeks.
Classical statistical models win when:
- You have short history. Under about two full seasonal cycles — roughly 24 monthly points, or two years of weekly data — a neural network has nothing to learn from. ARIMA and ETS were designed for exactly this scarcity.
- The series is one clean signal. One metric, stable seasonality, no external drivers. A tuned AutoARIMA is very hard to beat here, and it trains in milliseconds.
- You have to explain it. “Trend plus yearly seasonality plus a holiday bump” is a sentence a CFO accepts. A transformer’s attention weights are not.
- Nobody owns the model long-term. Classical models drift gracefully. Deep models need retraining discipline, and without an owner they rot quietly while still returning confident numbers.
Machine learning forecasting tools win when:
- You have many related series. This is the big one. Forecast 4,000 products together and a global ML model learns patterns from products with history and applies them to products without — cross-learning that classical per-series models structurally cannot do.
- External drivers matter. Price, promotions, weather, competitor activity, marketing spend. Gradient boosting and deep forecasters absorb covariates naturally. Bolting them onto ARIMA is painful.
- The relationships are non-linear. Threshold effects, saturation curves, interactions between drivers. Linear models cannot represent these no matter how you tune them.
- You have long, high-frequency history. Years of hourly or daily data is where deep learning starts earning its compute bill.
Here’s the honest workflow I’d run, and it’s deliberately boring:
- Start with seasonal naive. Last year’s same week. It takes one line and it is your error floor. If a fancy model can’t beat this, the problem is your data, not your model.
- Add AutoARIMA or ETS via StatsForecast. Minutes to run across every series.
- Run Chronos zero-shot. No training, instant comparison point.
- Only then try gradient boosting or a neural forecaster — and only if steps 1-3 left real error on the table.
- Backtest on rolling windows, never a single split. One lucky holdout period has sold more bad forecasting projects than any sales team.
I’d bet most teams stop at step 2 or 3 and ship something useful. That’s not settling — that’s the correct answer arriving early. The teams that skip to step 4 because deep learning is more interesting are the ones still “exploring” six months later. Picking the smallest tool that solves the problem is the same discipline I argue for in my three-tier definition of AI automation: match the tier to the job, don’t buy the most impressive tier available.
Java Predictive Analytics: The JVM Options Nobody Lists

Search for Java predictive analytics and you’ll mostly find Stack Overflow threads from 2014 and people telling you to just use Python. Unhelpful, if you’re the one with a Spring Boot service, a Kafka topic and a platform team that doesn’t deploy Python.
The real reason to stay on the JVM isn’t language preference — it’s deployment. A model that scores inside your existing service has no network hop, no serialization boundary, no second runtime to patch, and no separate on-call rotation. If predictions need to happen inside a request cycle, that’s decisive.

⚡ 取得人工智慧優勢
每週提供真正省時省錢的AI小技巧。沒有廢話,沒有誇大其詞——只有切實有效的方法。.
Your genuine options:
- Tribuo (Apache-2.0, 1.4k stars) — Oracle’s JVM ML library, and the one I’d reach for first in a production Java service. Classification, regression, clustering, anomaly detection, plus provenance tracking: every model records the data and config that produced it. For audit trails, that’s a feature you’d otherwise build yourself.
- Smile (6.4k stars) — the broadest statistics and ML coverage on the JVM, with Java, Scala and Kotlin APIs. Fast and well-documented. GitHub can’t classify its license, so read the license file before it ships in a commercial product.
- DeepLearning4J (Apache-2.0, 14.3k stars) — the mature choice for neural networks on the JVM, and it imports Keras models, so a Python team can train and a Java team can serve.
- H2O-3 (Apache-2.0, 7.5k stars) — Java core with Python and R APIs on top. Its AutoML will race algorithms and hand you a leaderboard, and trained models export as a plain Java object (a POJO or MOJO) you drop straight into a JVM service. Often the pragmatic winner: build in Python, deploy in Java.
- Apache Spark MLlib (Scala/Java, Apache-2.0) — the answer when data volume, not model sophistication, is the constraint. If your features already live in Spark, keep training there.
- Weka (GPL) — good GUI, excellent for teaching and quick exploration, and the standard entry on every list. Its GitHub mirror has been quiet since 2022. Fine for learning, not where I’d start a new build.
The pattern worth stealing: train wherever the tooling is best, deploy wherever your infrastructure already lives. H2O’s MOJO export and DL4J’s Keras import both exist precisely because that split is the normal case, not an edge case.
Installing and Running Open Source Predictive Analytics Without Burning Your Budget

You don’t need a cluster. Nearly everyone starts by over-provisioning, so let’s go in the other direction.
Stage one — your laptop. A virtual environment and three packages. This is a real stage, not a toy one.
python -m venv .venv && source .venv/bin/activate
pip install statsforecast prophet scikit-learn pandas
If your data fits in memory — and a few million rows does — you can do the entire project here. Classical forecasting on 50,000 series runs on a laptop in minutes. Do not rent a Kubernetes cluster to find out whether your data is forecastable at all.
Stage two — one small server. When the forecast needs to run on a schedule without you, put it in a container on a modest VPS. Two vCPUs and 4 GB of RAM handles a daily classical forecasting job over tens of thousands of series comfortably. A cron job and a Python script beat an orchestration platform until you have several interdependent jobs.
FROM python:3.12-slim
WORKDIR /app
COPY requirements.txt .
RUN pip install --no-cache-dir -r requirements.txt
COPY . .
CMD ["python", "forecast.py"]
Stage three — a scheduler. Once you have data pulls, feature building, training, scoring and a write-back that must run in order and retry sensibly, reach for a real orchestrator. Airflow, Dagster or Prefect all work. Add this when dependency management actually hurts — not before.
Stage four — distributed compute. Spark, Dask or Ray, for when data genuinely exceeds one machine’s memory. Most small and mid-sized businesses never arrive here, and the ones that get here early usually got there by storing raw events they should have aggregated.
A few things that will save you money and dignity:
- Pin your versions. An unpinned
pip installis a forecast that silently changes when a dependency ships a minor release. - Train on a schedule, score on demand. Training is expensive and infrequent. Scoring is cheap and constant. Conflating them is the most common way to turn a $20/month job into a $400/month one.
- GPUs only for deep models. Classical forecasting gets nothing from a GPU. Renting one to run ARIMA is pure waste.
- Log every prediction with its inputs. Without this you cannot diagnose drift later, and you will need to.
- Put a cost ceiling on it from day one. Budget alerts are cheaper than surprise invoices.
The staging is the actual advice. Each level adds capability and a maintenance tax, and you should only pay the tax once the previous stage visibly hurts.
Where Open Source Predictive Analytics Pays Off

A forecast nobody acts on is a hobby. Every case below ends in a decision that changes because of the number.
- Demand and inventory. Probabilistic forecasts per SKU set reorder points and safety stock. The decision is how much to buy. GluonTS or StatsForecast, and the ROI is immediate because stockouts and dead stock both have price tags.
- Churn and retention. Classification on behavioural features gives you a risk score per account. The decision is who gets a call this week. scikit-learn handles this, and it’s usually the highest-ROI first project because the action is obvious and cheap.
- Lead scoring. Rank inbound leads by conversion probability so sales works the top of the list instead of the top of the inbox. I went deeper on the implementation in 利用人工智慧進行預測性領先評分.
- Staffing and capacity. Forecast call volume, covers, or ticket load by hour. The decision is next week’s roster. Strong intraday seasonality makes this a good fit for classical models, and the savings are measurable in payroll.
- Cash flow. Forecast receivables and payables to see the squeeze before it arrives. The decision is whether to draw credit. Short history and a clean signal — classical models, again.
- Predictive maintenance. Sensor data plus anomaly detection flags equipment before it fails. The decision is when to schedule the technician. Tribuo if the plant runs on the JVM.
- Personalisation. Propensity models decide what each customer sees next. Doable without a data team — that’s the argument I make in AI personalisation for solopreneurs.
Notice what’s missing: nobody on this list is “doing predictive analytics.” They’re deciding how much to order, who to call, and when to send the technician. Pick the decision first. The model is downstream of it.
How to Actually Pick: A Decision Path That Ends in One Tool

Comparison tables create paralysis. So here’s the path I’d walk a client down, in order, out loud.
1. Name the decision that changes. If you can’t finish “because of this forecast, we will do X differently,” stop. There’s no project here yet. This kills more bad analytics initiatives than any technical review.
2. Count your series. One to ten? Prophet or StatsForecast, done this week. Hundreds to thousands? StatsForecast for scale, and consider a global ML model. Tens of thousands with covariates? Now deep learning earns consideration.
3. Measure your history. Fewer than two seasonal cycles means classical models, no debate. Years of daily or hourly data opens the ML door.
4. Decide whether you need a range. If the number drives inventory, staffing or cash, you need intervals — go probabilistic with GluonTS or StatsForecast’s prediction intervals. If it’s a directional dashboard number, a point estimate is fine.
5. Check your runtime constraint. Python shop? Everything’s open. JVM-only deployment? Tribuo, Smile, DL4J or H2O’s MOJO export. Need scoring inside a request cycle? That constraint outranks model accuracy.
6. Be honest about the owner. Name the person. If you can’t, pick the most boring tool on the shortlist — the one a stranger can read in six months. An unowned deep model is a liability that returns confident numbers while being wrong.
7. Ship the baseline this week. Seasonal naive, then AutoARIMA, then Chronos zero-shot. Three days, not three months. You now have a measured error number, and every future decision is an argument against a real baseline instead of a vibe.
Then stop optimising. The forecast doesn’t need to be excellent — it needs to be better than the gut call it replaces, and trusted enough that someone acts on it. A 15% error that drives weekly reorder decisions beats an 8% error nobody looks at.
If your constraint is step 6 — the owner, not the tool — that’s a resourcing problem wearing a technology costume, and no library on this page fixes it. That’s the point where it’s worth bringing in help; I wrote an honest comparison of AI automation consultants, including where I fit and where I don’t, if you’re weighing that.
Open Source Predictive Analytics: Frequently Asked Questions
What is the best open source predictive analytics tool?
There is no single best open source predictive analytics tool — it depends on your data shape. For general machine learning, scikit-learn is the default baseline. For forecasting a handful of business series, use Prophet or StatsForecast. For thousands of series at speed, use StatsForecast. For probabilistic forecasts that drive inventory or staffing decisions, use GluonTS. For an instant zero-shot baseline with no training, use Chronos.
Is open source predictive analytics really free?
The software licence is free, but running it is not. You still pay for compute, storage, and — by far the largest cost — the engineer who owns the pipeline. Open source removes per-seat licence fees and vendor lock-in; it adds a maintenance obligation. Budget for the owner, not the licence.
What are the best free predictive analytics tools?
The strongest genuinely free options are open source libraries rather than free SaaS tiers: scikit-learn for general modelling, StatsForecast and Prophet for forecasting, Orange for visual no-code workflows, and H2O-3 for AutoML. Free commercial tiers usually cap rows, seats or refresh frequency, and those limits can change. An Apache-2.0 or MIT licence cannot be revoked.
What is the best open source forecasting software?
For classical statistical forecasting at scale, StatsForecast (Nixtla) is the strongest option — AutoARIMA, ETS and Theta models that fit thousands of series in parallel. Prophet is the fastest route to a first usable forecast. Darts and sktime are best when you want to compare many model families behind one API. Note that Prometheus, InfluxDB and Grafana are time-series databases and dashboards, not forecasting tools.
Are machine learning forecasting tools better than ARIMA?
Not automatically. ARIMA and other classical models usually win with short history, a single clean series, or when you must explain the model. Machine learning forecasting tools win when you have many related series to learn across, meaningful external drivers such as price or promotions, non-linear relationships, or years of high-frequency data. Always benchmark against seasonal naive and AutoARIMA before investing in a deep model.
Can you do predictive analytics in Java?
Yes. Tribuo (Oracle) is a solid production choice for JVM services and includes model provenance tracking. Smile offers the broadest statistics and ML coverage with Java, Scala and Kotlin APIs. DeepLearning4J handles neural networks and can import Keras models. H2O-3 has a Java core and exports trained models as POJO or MOJO objects you can drop into a JVM service, which makes it popular for teams that train in Python and deploy in Java.
How much data do I need for predictive analytics?
For forecasting, aim for at least two full seasonal cycles — roughly 24 monthly data points or two years of weekly data. Below that, use classical models such as ARIMA or ETS, or a pretrained foundation model like Chronos. For classification tasks such as churn prediction, a few thousand labelled examples with a reasonable share of positive cases is usually workable.
Is Apache Superset a predictive analytics tool?
No. Apache Superset is a business intelligence and data visualisation platform for dashboards and SQL exploration. It does not generate forecasts. It appears on predictive analytics roundups because it is popular open source data tooling, but you still need a separate forecasting library and should feed the results into Superset for display.
Should I still use Weka in 2026?
Weka remains a good teaching tool with an approachable GUI for exploring algorithms, but its GitHub mirror has had no pushes since August 2022 and development happens on the University of Waikato's own infrastructure. For a new production build in 2026, choose scikit-learn in Python or Tribuo on the JVM instead.
What licence should I look for in open source predictive analytics tools?
Apache-2.0, MIT and BSD-3-Clause are permissive and safe for commercial use, including closed-source products. GPL-3.0 (used by Orange) adds copyleft obligations that matter if you redistribute your software. When a repository's licence is unclassified — Smile shows as "Other" on GitHub — read the licence file before shipping it in a client deliverable.
Final Take
Open source predictive analytics stopped being the scrappy alternative a while ago. The forecasting stack available for free under permissive licences in 2026 — StatsForecast, Darts, sktime, GluonTS, Chronos — is genuinely strong, and a laptop plus three packages gets you a working forecast this afternoon.
What hasn’t changed is where projects die. Not on model selection. They die because nobody named the decision the forecast was supposed to change, or because nobody owned the pipeline on month three. Both are answered before you install anything.
So the whole guide compresses to this: name the decision, count your series, ship the seasonal-naive baseline this week, and only add sophistication when you’ve measured that the simple version isn’t good enough. Most teams discover the simple version was fine — which is a win, not an anticlimax.
Open a terminal. Install StatsForecast. Forecast one series you actually care about. You have an afternoon.
建置無需你也能運作的系統
I run 10+ autonomous containers in production and send what actually works — real systems, real logs, no fluff. Grab the playbook and follow the build.
📥 免費:《人工智慧劇本》
我用來經營一人代理公司的所有工具和工作流程。 25 年的行銷經驗濃縮成一份實用指南。免費贈送。.