

Updated 18 November 2026: re-ran every number on 2,100 runs (was 1,321), added a step-by-step build, a tool table with prices checked on vendor pages, and a section on what the dashboard predicted vs. what actually happened.
A predictive analytics dashboard is a dashboard that tells you what is likely to happen next, not just what already happened. Search for one and the first page is product pages and listicles. Retool will generate one from a prompt, Bold BI has sample ones, and Tableau explains the theory. When I loaded Retool’s predictive analytics dashboard template on 18 November, its embedded demo showed a SQL syntax error and “0 results”. Most of these pages never show a dashboard built on real data making a prediction you could check later.
So I built one on my own infrastructure. It covers every unattended run of my AI agent fleet: 1,321 runs when I first published this in September, and 2,100 runs from 12 June to 17 November 2026 now. It answers one question: 我能在它落地之前預見到失敗嗎? Below is the build, the numbers, the trap that makes most predictive dashboards lie, and what happened when I checked September’s forecast against two more months of data.
The short answer, if you’re in a hurry:
- If your data is already clean (warehouse, database, tidy sheet), buy a builder. Power BI, Tableau, Zoho Analytics or Google’s Data Studio will chart it this afternoon. Prices are in the table below.
- If your data is files, exports, logs or an inbox, the dashboard is the easy 10%. The pipeline that turns that mess into rows is the project, and an AI agent can write it in an afternoon.
- Either way, score features with lift rather than accuracy, test every “perfect” predictor for leakage, and put a re-run date on every number.
What a Predictive Analytics Dashboard Is (and What a “Builder” Actually Builds)

A normal dashboard answers “what happened?” A predictive analytics dashboard answers “what is likely to happen, and to which rows?” Revenue last month is reporting. Which 12 customers are likely to cancel next month is prediction. The chart can look the same either way. What makes it predictive is a score attached to each row, based on something you knew before the outcome.
The phrase “predictive analytics dashboard builder” covers two different products, and picking the wrong one can cost you months.
將建構器作為設計工具。. Figma Make, Retool, Bold BI, Zoho Analytics and the big BI suites. You describe or drag the dashboard, it creates the layout, charts and filters, and you connect a data source. These tools are good now. If your data already lives somewhere clean and queryable, use one.
構建器作為管道。. Something has to decide what a row is, pull it out of wherever it lives now, build the features, score the rows, and do it all again tomorrow. Drag-and-drop tools don’t do that, because it isn’t a design problem.
The product pages leave this part out: in most real businesses, the second problem is about 90% of the work. My data didn’t live in a warehouse. It lived in thousands of plain-text log files written by 20 different jobs, with no schema, no database and no API. Most small-business data looks like that: Stripe exports, inbox archives, form submissions, and a CSV a VA has kept up since 2023.
A dashboard builder needs structured data, and the expensive question is who structures it. For a solo operator in 2026, an agent can do that in an afternoon. I’ve written about 克勞德代碼代理商在我公司實際運作的內容, and this build is the clearest single example.
Predictive Analytics Dashboard Examples: 4 Shapes Worth Copying

Almost every useful predictive analytics dashboard for a small or mid-sized business is one of four shapes. In each one, a row is a thing you can act on, and the outcome is a yes/no you’ll find out later.
| 例子 | One row is… | Outcome it predicts | Features known in advance | What you do with the score |
|---|---|---|---|---|
| Churn risk | A customer this month | Cancels within 30 days | Logins trend, support tickets, plan age, failed payments | Call the top 10 before renewal |
| Late payment | An open invoice | Paid more than 14 days late | Client’s past lateness, invoice size, terms, month-end timing | Send reminders early, change terms |
| Lead scoring | A new lead | Books a call within 21 days | Source, company size, pages viewed, reply speed | Route the top band to a human first |
| Ops failure (mine) | One automated run | The run fails | Job type, time slot, which external APIs it calls | Watch the risky jobs, fix the dependency |
Two rules apply to all four. First, the outcome has to occur often enough to learn from. Aim for at least 30 occurrences, or you’re reading noise. Second, every feature has to exist 前 the outcome. Breaking that rule is the most common way these dashboards fail, and I broke it myself (see the leakage section below). I wrote up more 預測分析儀表板範例 以及 design best practices separately. The rest of this post builds the fourth one with real data.
The Dashboard I Built: 1,321 Agent Runs, Then 2,100

My setup runs a fleet of autonomous brand containers. Each one wakes on a cron schedule, runs one skill (write a blog post, check email, mine social, sweep Search Console), and goes back to sleep. Every run writes a log file. The filename holds the date, the dispatch slot and the job type. The footer holds an exit code and a UTC timestamp.
Here is what those files turned into, as of 17 November 2026:
- 2,116 run logs from 12 June to 17 November 2026
- 20 job types, from blog-writer to sendy-sync
- 2,100 runs with a readable exit code (16 logs had none)
- 50 hard failures (non-zero exit), for a base rate of 2.38%. In September it was 49 of 1,306, or 3.75%.
The base rate is the first useful number, and almost nobody puts it on a slide. At 2.38%, a “model” that predicts “nothing ever fails” is right 97.6% of the time and is completely useless. That’s the accuracy trap that kills most predictive dashboards in month two.
儀錶板真正發揮作用的地方就在於它能提供按任務細分的數據:
| 工作類型 | 跑 | 硬性失敗 | 故障率 | Median min | p90 min | Max min |
|---|---|---|---|---|---|---|
| 社工 | 154 | 8 | 5.2% | 6.6 | 18.5 | 37.2 |
| 社交海報-2 | 158 | 7 | 4.4% | 8.6 | 16.5 | 52.0 |
| 社交海報-1 | 159 | 6 | 3.8% | 7.0 | 10.1 | 21.6 |
| asana 檢查 | 157 | 5 | 3.2% | 1.0 | 3.4 | 16.7 |
| 部落客 | 156 | 4 | 2.6% | 12.6 | 16.9 | 53.7 |
| 連結推廣指揮 | 157 | 4 | 2.5% | 6.8 | 12.8 | 36.5 |
| 電子郵件檢查器 | 311 | 4 | 1.3% | 2.8 | 5.2 | 14.0 |
| 每日貢獻 | 156 | 1 | 0.6% | 4.5 | 9.1 | 19.4 |
| 簡報撰稿人 | 22 | 0 | 0.0% | 5.3 | 6.3 | 7.3 |
| gsc-ga4-sweep | 22 | 0 | 0.0% | 3.7 | 12.1 | 20.6 |
12 Jun – 17 Nov 2026. Two weekly research jobs with 23–24 runs each (content-researcher, keyword-researcher) had 2 failures apiece. That’s the highest rate on paper, but the sample is too small to rank on.
The jobs that call third-party publishing APIs are at the top, and the jobs that only touch my own files are at the bottom. Failures follow how many outside services a job depends on, not how complex the task is. blog-writer does by far the most reasoning on the fleet, yet it fails less often than asana-check, which mostly calls a single API.
The table also shows a second pattern: runtime is all over the place. Same job, same prompt, same code, and blog-writer still ranges from a median of 12.6 minutes to a maximum of 53.7, and the slow run still produced correct output. So “alert me if a job runs long” would have paged me dozens of times for runs that were fine. If you run unattended agents, 運作時包絡線是沒人會去偵測的東西。, and it’s the first thing that will mislead you.

竊取整套戰術手冊
我會發送實際的建置流程——腳本、資料以及出錯的零件。沒有理論,沒有廢話。立即取得 AI 策略手冊,並在您的信箱中收到下一期。.
How to Build a Predictive Analytics Dashboard, Step by Step

This is the part a no-code builder can’t do for you. There are five steps, the flow is data source → rows → features → score → dashboard, and only the last step is a chart.
Step 1: Write down the row and the outcome, in one sentence
Every predictive project lives or dies here. A row is one thing that either did or didn’t have the outcome. Mine: one row is one agent run, and the outcome is “exit code is not 0”. If you can’t write yours in one line, you don’t have a predictive problem yet. You have a reporting problem, and a reporting dashboard will serve you better and cost less.
Step 2: Point an agent at the data source and have it extract rows
The extraction is about thirty lines of Python: list the log folder, pull the date and job type from each filename, pull the exit code and timestamp from each footer, work out the duration, and count the bytes. I didn’t write it myself. I described the log format and the row sentence to the agent, let it write the script, and then checked its output against five files by hand.
Don’t skip that check. The agent’s first pass correctly dropped runs longer than four hours as parse errors, but it also quietly dropped the logs that had no exit code, and those turned out to matter. Read the extraction code, because that’s where a quiet bug turns into a confident wrong number later on.
Step 3: Build features that exist before the outcome
A feature is only allowed if you could know it at prediction time. Mine were deliberately simple: job type, dispatch slot, and how many external APIs the job calls. The leakage section below shows how badly it goes when you break this rule.
Step 4: Score with lift, not accuracy
For each feature, split the rows into groups, work out the failure rate in each group, and divide by the base rate. That ratio is 舉起: how many times more likely a failure is in this group than at random. At a 2–4% base rate, lift tells you the truth and accuracy doesn’t. You don’t need a model, training or an ML library, just a grouped count and a division. Most small-business predictive analytics is exactly that, and you only need more once this stops being enough.
Step 5: Render it, then schedule the re-run
Only now do you open a dashboard tool. I render a PNG from the same script (the chart in the “two months later” section below is that output), but you could just as easily drop the scored rows into Power BI, Data Studio or a Google Sheet. The important part is that the whole pipeline regenerates with one command. If you can’t rebuild a number on demand, it’s a screenshot, not a metric. If you want the infrastructure side, I covered 我整個艦隊運作都依賴這一個盒子。 分別地。.
洩漏陷阱:我最好的預測工具完美無缺,卻完全沒用

Every skill in my system is supposed to end by printing a contract line: 技能結果:成功 | .... I tested whether a missing contract line predicts a failed run. Here’s the result on all 2,100 runs (September’s numbers are in brackets):
| 團體 | 跑 | 硬性失敗 | 故障率 | 舉起 |
|---|---|---|---|---|
| 日誌缺少 SKILL_RESULT | 94 (65) | 50 (49) | 53.2% (75.4%) | 22.3× (20.1×) |
| 日誌包含 SKILL_RESULT | 2,006 (1,241) | 0 (0) | 0.0% | 0.00× |
It catches 50 of 50 hard failures: 100% recall and zero misses. In September, adding “log size in the bottom 10% for its job type” pushed it to a 92.5% hit rate and 24.6× lift.
一個能夠完美預測結果的模型並非成功之作,而是漏洞報告。.
⚡ 取得人工智慧優勢
每週提供真正省時省錢的AI小技巧。沒有廢話,沒有誇大其詞——只有切實有效的方法。.

想想 為什麼 the line is missing. A run that crashes dies before it reaches the line that prints 技能結果. The feature doesn’t predict the failure. The feature 是 失敗,換了一種表現。這是 目標洩漏, and it’s the most common reason a predictive dashboard looks brilliant during the build and does nothing in production.
測驗只有一個問題: 我能否在結果發生前就知道這個數值? For a missing contract line, no. It only exists once the run is already over, so it can’t predict anything or give me time to step in.
A perfect leaky feature still makes a perfect detector, though. It’s useless for forecasting and very good for monitoring. So I moved it out of the prediction column and into an alert rule, where it belongs.
The ghost runs: 16 in September, 44 now
Subtract the hard failures from the missing-line group and you’re left with runs that exited 0, reported success to every monitoring tool, and never printed the line that proves they did the work. In September there were 16. On the full data there are 44: 18 up to 20 September (today’s script counts two more than September’s did) and 26 since. They’re spread across 13 job types, led by blog-writer (7), daily-contribution (6), social-poster-1 (5) and link-outreach-lead-finder (5).
So while the loud failures disappeared, the quiet ones went 向上. That’s the shape of 代理靜默故障問題: the dangerous failures never go red.
The detector has a weakness too. I opened the three most recent ghost runs (2, 5 and 15 November, all link-outreach-lead-finder). In each one the work had finished, but the run’s last message was a note about a stuck background wait-loop it had killed, so the contract line never made it into the log. Those are false positives. A detector built on “the last line of the log” decays as the agent’s habits change, just like a forecast does. The fix is the same as in September: treat a missing contract line as “needs a look”, not as “failed”, and check it against the actual output.
What My Predictive Analytics Dashboard Forecast vs. What Happened (Sep → Nov)
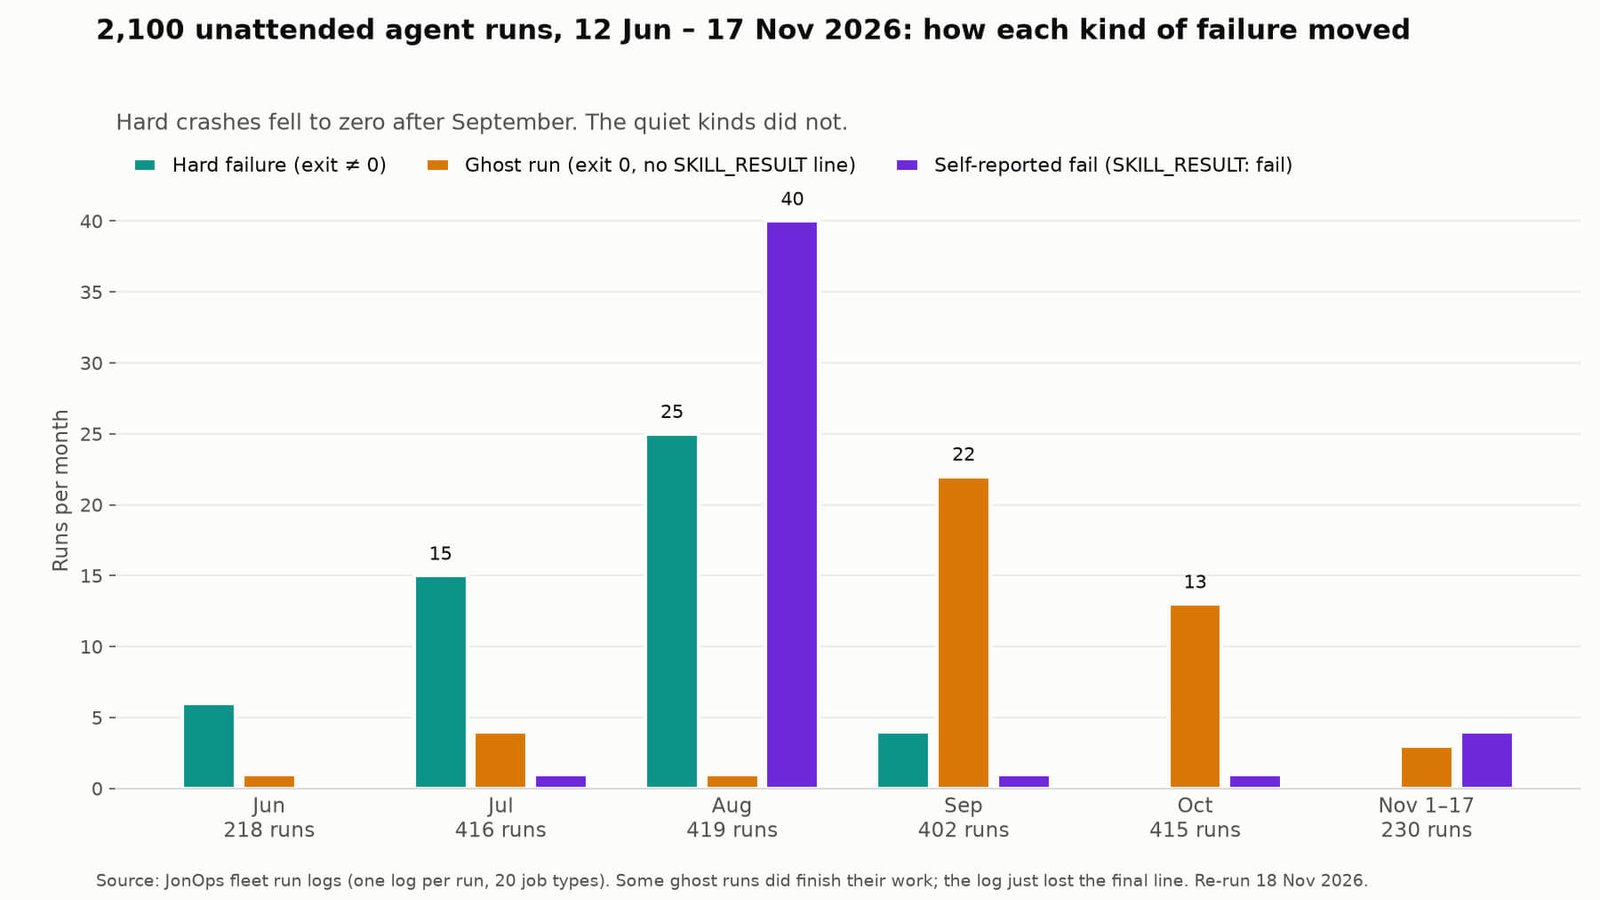
This is the section I couldn’t write in September. The dashboard had a clear forecast: the jobs with the highest failure rates from 12 June to 20 September would keep failing the most. The top five were content-researcher (14.3%), keyword-researcher (13.3%), social-miner (8.3%), social-poster-2 (7.0%) and social-poster-1 (5.9%).
Here’s what happened from 21 September to 17 November:
- Those five jobs ran 192 times and had 0 hard failures.
- The whole fleet had 1 hard failure in 781 runs (0.13%, down from 3.71%). It was link-outreach-conductor on 25 September. There have been 712 runs since with no crash.
- In September I wrote that every run after 6 September had exited clean. The 25 September crash proved that wrong. That’s another claim that only got caught because the query is cheap to re-run.
Was the forecast wrong? It expired. Whatever drove the summer crashes stopped driving them: 25 hard failures in August, 4 in September, then 0 in October and 0 so far in November. I can’t pin a cause on each of those 50 crashes after the fact, and I’m not going to pretend I can. What I can say is that a ranking learned on the old regime was ranking a world that no longer existed. On operational data that’s normal and often good news. A forecast about your own systems is meant to stop being true once the system changes.
The chart shows the other half. August’s 40 self-reported fails were one root cause: a revoked social-scheduling token blocked both social posters from 1 to 22 August, and every run correctly reported 技能結果:失敗 and stopped. Forty identical failures in a row isn’t something to forecast. It’s one alert that should have reached a human on day two. Hard crashes then dropped to zero after September, while ghost runs peaked (22 in September, 13 in October).
Findings decay: the claim my own dashboard falsified
In August my notes recorded a finding I was proud of: all 41 hard failures came from 2 of the 20 job types. When I re-ran the query at every historical cut-off, it was never true:
| 截至 | 跑 | 硬性失敗 | 受影響的職位類型 | 前兩名份額 |
|---|---|---|---|---|
| 2026年8月15日 | 835 | 39 | 20人中的13人 | 33.3% |
| 2026年8月31日 | 1,053 | 46 | 20人中的13人 | 30.4% |
| 2026年9月10日 | 1,186 | 49 | 20人中的13人 | 30.6% |
| 2026年9月20日 | 1,319 | 49 | 20人中的13人 | 30.6% |
| 20 Oct 2026 | 1,724 | 50 | 20人中的13人 | 30.0% |
| 17 Nov 2026 | 2,100 | 50 | 20人中的13人 | 30.0% |
The 20 Sep row shows 1,319 runs here and 1,306 in the September version. Today’s script reads 13 more logs for the same window. The failure counts match exactly.
The “2 of 20” finding wasn’t stale. It was wrong when I wrote it, and it survived a month because it was quotable and nobody re-ran it. A dashboard’s job isn’t to produce findings. Its job is to make findings cheap to re-check, so the wrong ones get caught. The same logic applies to content, which I covered in 內容衰減的真正原因在於你的觀點過時了。.
- 每個號碼都會有重播日期。. If you can’t regenerate it with one command, it’s a screenshot.
- 每項發現都會有一個視窗版本。. Not “13 of 20 job types” but “13 of 20 as of 17 November, plus the same query at five earlier cut-offs”.
- Re-run before you quote. This refresh cost one command and caught one wrong claim, plus a detector that had started producing false positives.
Predictive Analytics Dashboard Tools Compared (Prices Checked 18 Nov 2026)

The no-code builders aren’t bad. They’re very good, and for many readers one of them is the right answer. I checked every price below on the vendor’s own pricing page on 18 November 2026. Plans change often, so treat them as a starting point.
| 工具 | 最適合 | Entry price (vendor page, 18 Nov 2026) | Where the prediction comes from |
|---|---|---|---|
| Google Data Studio (formerly Looker Studio) | Free reports on Google data: Sheets, GA4, BigQuery | Self-service tier free; Pro priced per user, varies by term | Score rows upstream (Sheets, BigQuery) and chart the result |
| Power BI | Microsoft 365 shops | Free account + free Desktop; Pro $14/user/mo; Premium Per User $24/user/mo (paid yearly) | Forecast lines on time series; heavier models via the Microsoft stack |
| Tableau | Analyst teams | Standard from $15/user/mo, Enterprise from $35 (billed annually); free Desktop edition | Built-in forecasting on time series; custom models plugged in |
| Zoho Analytics | SMBs on a budget | Free plan; Basic US$24/mo, Standard $48, Premium $115 (billed annually) | Check which AI/forecast features your tier includes |
| Retool | Internal apps over your own database | Free; Team $10/builder + $5/internal user; Business $50 + $15 (billed annually) | None built in: it’s a UI over your SQL or API |
| Figma Make | Designing the dashboard UI from a prompt | Starter free; Professional full seat $16/mo | None: design and prototype, not a data pipeline |
| Bold BI | Embedded BI for many viewers | Cloud $999/mo for 100 users; On-Premises from $499/mo; free Community License for small companies | AI features billed in credits ($40 per 1,000) |
| Databricks AI/BI | Teams already on Databricks | No per-seat BI license; compute (DBU) rates apply | Models on the same platform as the data |
| Agent-built (Claude Code + a script) | Data in files, logs, exports, inboxes | Claude Pro $20/mo ($17/mo annual), checked 17 Nov | You define the row, features and score. That’s the point. |
If you want a wider shortlist that includes the ML platforms (DataRobot, SAS, H2O), I compared 預測分析工具 和 開源預測分析工具 分別地。.
And here’s the honest split between the two kinds of “builder”:
| 無程式碼儀錶板建構器 | 代理建構的管道 | |
|---|---|---|
| 最佳時機 | 資料已清理乾淨且可查詢。 | 資料包括文件、匯出文件、日誌和收件匣。 |
| 首次圖表繪製時間 | 不到一小時 | 一個下午 |
| 客製化功能工程 | 僅限於使用者介面所顯示的內容 | 任何你能描述的事物 |
| 成本形狀 | 每個座位,永久有效 | Subscription or tokens, then pennies to re-run |
| 誰負責維護它 | 供應商 | You (this is the real cost) |
| 防漏保護 | 沒有。它會很樂意地繪製一個洩漏特徵。 | None either. That’s on you. |
Look at the last row. Neither approach protects you from the mistake that actually breaks predictive dashboards. A tool can’t know which of your columns comes after your outcome. That judgement is the job, and you can’t buy it in any pricing tier.
- 資料已存在於資料倉儲中,還是資料表是全新的? Buy a builder. Power BI or Tableau will beat anything you hand-roll, today.
- 文件、日誌、匯出文件或收件匣中的資料? Build the pipeline with an agent. The extraction is the project.
- Not sure you have a predictive problem at all? Do the grouped count and division in a spreadsheet first. If no feature reaches about 2× lift, you don’t need a model. You need better data collection.
For where agents fit compared with chat tools, I wrote up Claude 和 Claude Code 在企業營運上的區別.
常見問題解答
What is a predictive analytics dashboard?
It’s a dashboard that shows a likely future outcome for each row (customer, invoice, lead, job run), not just totals for the past. It’s predictive because of a score built from information you had before the outcome. The chart type doesn’t matter.
What should a predictive analytics dashboard show?
Four things: the base rate of the outcome, the rows ranked by risk or score, the lift of the features driving that score, and the date the numbers were last regenerated. If any of these is missing, ask why. The re-run date is the one that’s missing most often.
How much does a predictive analytics dashboard cost?
The software can be $0: Data Studio, the Power BI free account and Desktop, Tableau’s free Desktop edition, and Zoho’s free plan all exist. Paid seats start around $14–$15 per user per month (Power BI Pro, Tableau Standard, billed annually, checked 18 Nov 2026). The real cost is the pipeline and its upkeep. For me that’s an afternoon of agent work plus the subscription I already pay.
我需要機器學習來建立預測儀錶板嗎?
Usually not. Everything in this article is grouped counts divided by a base rate, with no training. If nothing reaches about 2× lift, a model won’t rescue you, because there’s no signal to find.
什麼是目標洩漏?如何避免目標洩漏?
Target leakage happens when a feature secretly contains the answer, because the outcome causes it rather than the other way round. My missing-contract-line feature hit 100% recall because crashed runs die before printing the line. Test each feature by asking whether you could have known it before the outcome. If not, it’s leakage. You can still use it as an alert, never as a forecast.
為什麼準確率對於預測儀錶板來說不是一個好的指標?
Because of the base rate. My failures happen at 2.38%, so “never fails” is 97.6% accurate and useless. Use lift, precision and recall against the base rate. If someone quotes only accuracy, ask what share of rows have the outcome.
How much data do I need?
You need enough outcomes, not just rows. I have 2,100 rows but only 50 failures, and the 50 is what limits everything. Aim for at least 30 occurrences of the thing you’re predicting.
人工智慧代理能否自行建置和維護儀表板?
It can build it: the extraction and analysis code here was written by an agent in an afternoon. Maintaining it unattended needs guardrails. My fleet’s hard failures fell to 0.13%, but 26 runs since September have reported success without printing their contract line. Some were real misses and some were false alarms. Check the output contract, not just the exit code, and re-run your findings on a schedule.
最後想說的話
If you came here to pick a predictive analytics dashboard tool, the shortest honest answer is this: if your data is clean, use Power BI, Tableau or the free Data Studio this afternoon and skip the rest. If your data is files, exports and logs, which it probably is, the dashboard isn’t the project. The pipeline is, and an agent will write it for you.
Two months later, my dashboard’s forecast had expired: the risky jobs stopped crashing. Hard crashes dropped from 3.71% to 0.13%. The quiet failures it had flagged went 向上, and the detector itself started producing false positives. None of that came from a model. It all came from structuring the data well enough to ask the same question three times.
Start with the smallest version: one row sentence, one extraction, a lift table, and suspicion of anything that looks perfect. Then put a re-run date on every number, including the ones in this article. These were regenerated on 18 November 2026, and I’ll re-run them again before I quote them.
取得下一個建置日誌
我每週都會發布實際運作情況、成本以及出現的問題——並附上具體數字。歡迎下載《人工智慧行動手冊》並關注後續內容。.
📥 免費:《人工智慧劇本》
我用來經營一人代理公司的所有工具和工作流程。 25 年的行銷經驗濃縮成一份實用指南。免費贈送。.